
It’s common knowledge that the COVID-19 pandemic resulted in an unprecedented surge in the amount of content Americans consume online, but as it turns out, the outbreak upended the type of content we’re consuming as well.
By analyzing referral, engagement and traffic data of thousands of websites, a new report by technology company Parse.ly shows how—and where—reader attention shifted in 2020.
Given the COVID outbreak, perhaps it’s not surprising that websites focusing on health and fitness saw dramatic spikes in engagement last year, experiencing a 307 percent increase when the pandemic struck the U.S. in March 2020 compared to March 2019. Sites specializing in careers saw an 188 percent year-over-year spike, and shopping sites witnessed a 162 percent lift. News was up 143 percent, followed by personal finance (100 percent), science (94 percent), business (89 percent) and food and drink (80 percent). Other top content categories were travel (72 percent), law, government and politics (71 percent), education (70 percent), pets (60 percent) and arts and entertainment (55 percent).
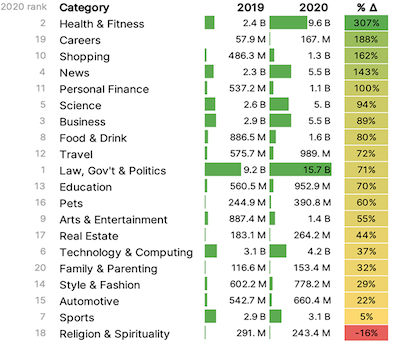 |
| Top page views for 2020. |
When analyzed month-over-month, some of these pageview spikes were even more dramatic. Shopping sites surged 421 percent in March 2020 from February, as more people shifted away from dining out or shopping to ordering groceries and goods online. Health and fitness sites were up 410 percent. Science sites climbed 166 percent in March 2020 from the month prior, and sites specializing in legal issues were up 162 percent. News was up 126 percent, food and drink content climbed 101 percent and law, government and politics grew 73 percent.
The only category to lose viewers in 2020 were websites catering to religion and spirituality, which lost 16 percent of the page views it had in 2019.
The study also found that online readership typically increases sharply at 6:00 a.m. each day and peaks sometime between 3:00 and 4:00 p.m. before steadily declining. Another smaller bump in traffic occurs between 9:00 and 11:00 p.m. each night.
Finally, the study discovered that the COVID-19 pandemic resulted in a 40 percent increase in smartphone usage in March 2020, a 23 percent rise in desktop usage and a 20 percent increase in tablet usage. Overall, mobile traffic to websites stands at about double that of desktop.
Parse.ly’s report “How 2020 Changed the Content Landscape, and What It Means for Content Creators in 2021,” relied on data aggregated and anonymized from the company’s network of more than 3,000 high-traffic sites, comprising 10 billion total monthly views. The study analyzed attention trends between January 2019 and December 2020.

 Trump Media & Technology Group today reported a $58.2M net loss on $4.1M in 2023 revenues, a disclosure that drove its stock price down 22.6 percent to $47.96.
 Barry Pollack, an attorney at Wall Street’s Harris St. Laurent & Wechsler, has registered Julian Assange as a client with the Justice Dept. “out of an abundance of caution.”
 Paramount Global to slash 800 jobs in what chief executive Bob Bakish calls part of an effort to “return the company to earnings growth"... Rolling Stone editor-in-chief Noah Shachtman is exiting at the end of the month due to disagreements with chief executive Gus Wenner over the direction the magazine is taking... The New York Times broke the $1 billion barrier in annual revenue from digital subscriptions in 2023... Press Forward is investing more than $500 million to strengthen local newsrooms.
 The majority of news articles are read within the first three days of publication, according to a recent report.
 The Los Angeles Times gives pink slips to 115 people or 20 percent of its newsroom staff... TIME is also laying off about 30 employees, which is approximately 15 percent of its editorial staff... The Baltimore Banner, which was launched by Stewart Bainum in 2022 after he failed to buy the Baltimore Sun, added 500 subscribers per day in the three days following Sinclair Broadcast Group's deal to purchase the Sun.


 Have a comment? Send it to
Mar. 31, 2021, by Joe Honick
Jon has done an invaluable job giving exposure to these realities. What would be equally as valuable for him might be a followup contribution, despite the assertion of "What it Means for Content Creators in 2021", is whether there is evidence these factors will or can be sustained as too many already seem to believe we can let up on disciplines learned from and by the COVID impact. The information here screams reality, but, then American audiences are fickle and often simply lazy and willing to adopt and adapt to fads quickly.